파이썬 데이터분석 - A/B test 분석
- 고객의 정기예금 가입 여부 예측을 위한 은행 마케팅 분류 모델 구축
- 자전거 대여 수요 예측을 위한 머신러닝 모델 구축
- 파이썬 데이터분석 - aarrr 분석 실습
- 파이썬 데이터분석 - 장바구니 분석(연관분석)2 - FP-Growth, 순차패턴마이닝
- 파이썬 데이터분석 - 장바구니 분석(연관분석) 실습
- 파이썬 데이터분석 - 장바구니 분석(연관분석)
- 파이썬 데이터분석 데이터시각화 실습
- 파이썬 데이터분석 데이터시각화2
- 파이썬 데이터분석 데이터시각화1
- 파이썬 데이터분석 클러스터와 차원축소 실습
- 파이썬 데이터분석 클러스터와 차원축소2
- 파이썬 데이터분석 클러스터와 차원축소
- 파이썬 데이터분석 라이브러리
A/B테스트 실습 : 멤버십 결제 페이지를 A안에서 B안으로 바꾸는게 좋을까?
1
2
3
4
import pandas as pd

data = pd.read_csv('/content/drive/MyDrive/30-day_Subscription_Data.csv')
data
| Unnamed: 0 | Date | Total Users | Subscribers | 1-Month Subscribers | 12-Month Subscribers | Revenue | Group | Conversion Rate | Revenue per User | 1-Month Revenue | 12-Month Revenue | |
|---|---|---|---|---|---|---|---|---|---|---|---|---|
| 0 | 0 | 2023-09-15 | 459 | 22 | 19 | 3 | 1547 | A안 | 0.047930 | 1.067538 | 665 | 882 |
| 1 | 1 | 2023-09-16 | 504 | 26 | 21 | 5 | 2205 | A안 | 0.051587 | 1.408730 | 735 | 1470 |
| 2 | 2 | 2023-09-17 | 514 | 26 | 22 | 4 | 1946 | A안 | 0.050584 | 1.206226 | 770 | 1176 |
| 3 | 3 | 2023-09-18 | 482 | 23 | 19 | 4 | 1841 | A안 | 0.047718 | 1.224066 | 665 | 1176 |
| 4 | 4 | 2023-09-19 | 512 | 25 | 19 | 6 | 2429 | A안 | 0.048828 | 1.542969 | 665 | 1764 |
| 5 | 5 | 2023-09-20 | 490 | 24 | 20 | 4 | 1876 | A안 | 0.048980 | 1.224490 | 700 | 1176 |
| 6 | 6 | 2023-09-21 | 539 | 25 | 23 | 2 | 1393 | A안 | 0.046382 | 0.797774 | 805 | 588 |
| 7 | 7 | 2023-09-22 | 450 | 21 | 18 | 3 | 1512 | A안 | 0.046667 | 1.066667 | 630 | 882 |
| 8 | 8 | 2023-09-23 | 446 | 22 | 18 | 4 | 1806 | A안 | 0.049327 | 1.300448 | 630 | 1176 |
| 9 | 9 | 2023-09-24 | 540 | 25 | 21 | 4 | 1911 | A안 | 0.046296 | 1.129630 | 735 | 1176 |
| 10 | 10 | 2023-09-25 | 512 | 26 | 20 | 6 | 2464 | A안 | 0.050781 | 1.562500 | 700 | 1764 |
| 11 | 11 | 2023-09-26 | 512 | 26 | 21 | 5 | 2205 | A안 | 0.050781 | 1.386719 | 735 | 1470 |
| 12 | 12 | 2023-09-27 | 593 | 30 | 24 | 6 | 2604 | A안 | 0.050590 | 1.416526 | 840 | 1764 |
| 13 | 13 | 2023-09-28 | 557 | 26 | 23 | 3 | 1687 | A안 | 0.046679 | 0.951526 | 805 | 882 |
| 14 | 14 | 2023-09-29 | 487 | 23 | 18 | 5 | 2100 | A안 | 0.047228 | 1.396304 | 630 | 1470 |
| 15 | 15 | 2023-09-30 | 513 | 26 | 22 | 4 | 1946 | A안 | 0.050682 | 1.208577 | 770 | 1176 |
| 16 | 16 | 2023-10-01 | 531 | 25 | 20 | 5 | 2170 | A안 | 0.047081 | 1.318267 | 700 | 1470 |
| 17 | 17 | 2023-10-02 | 523 | 26 | 21 | 5 | 2205 | A안 | 0.049713 | 1.357553 | 735 | 1470 |
| 18 | 18 | 2023-10-03 | 510 | 23 | 19 | 4 | 1841 | A안 | 0.045098 | 1.156863 | 665 | 1176 |
| 19 | 19 | 2023-10-04 | 502 | 23 | 20 | 3 | 1582 | A안 | 0.045817 | 0.996016 | 700 | 882 |
| 20 | 20 | 2023-10-05 | 431 | 20 | 17 | 3 | 1477 | A안 | 0.046404 | 1.090487 | 595 | 882 |
| 21 | 21 | 2023-10-06 | 528 | 27 | 24 | 3 | 1722 | A안 | 0.051136 | 1.022727 | 840 | 882 |
| 22 | 22 | 2023-10-07 | 461 | 22 | 18 | 4 | 1806 | A안 | 0.047722 | 1.258134 | 630 | 1176 |
| 23 | 23 | 2023-10-08 | 534 | 24 | 20 | 4 | 1876 | A안 | 0.044944 | 1.123596 | 700 | 1176 |
| 24 | 24 | 2023-10-09 | 464 | 23 | 19 | 4 | 1841 | A안 | 0.049569 | 1.271552 | 665 | 1176 |
| 25 | 25 | 2023-10-10 | 607 | 31 | 23 | 8 | 3157 | A안 | 0.051071 | 1.696870 | 805 | 2352 |
| 26 | 26 | 2023-10-11 | 460 | 22 | 19 | 3 | 1547 | A안 | 0.047826 | 1.065217 | 665 | 882 |
| 27 | 27 | 2023-10-12 | 476 | 23 | 21 | 2 | 1323 | A안 | 0.048319 | 0.861345 | 735 | 588 |
| 28 | 28 | 2023-10-13 | 606 | 31 | 24 | 7 | 2898 | A안 | 0.051155 | 1.551155 | 840 | 2058 |
| 29 | 29 | 2023-10-14 | 522 | 27 | 22 | 5 | 2240 | A안 | 0.051724 | 1.379310 | 770 | 1470 |
| 30 | 0 | 2023-09-15 | 516 | 35 | 28 | 7 | 3038 | B안 | 0.067829 | 1.899225 | 980 | 2058 |
| 31 | 1 | 2023-09-16 | 483 | 33 | 24 | 9 | 3486 | B안 | 0.068323 | 2.360248 | 840 | 2646 |
| 32 | 2 | 2023-09-17 | 488 | 31 | 24 | 7 | 2898 | B안 | 0.063525 | 1.926230 | 840 | 2058 |
| 33 | 3 | 2023-09-18 | 520 | 39 | 31 | 8 | 3437 | B안 | 0.075000 | 2.134615 | 1085 | 2352 |
| 34 | 4 | 2023-09-19 | 498 | 34 | 30 | 4 | 2226 | B안 | 0.068273 | 1.405622 | 1050 | 1176 |
| 35 | 5 | 2023-09-20 | 441 | 32 | 26 | 6 | 2674 | B안 | 0.072562 | 1.950113 | 910 | 1764 |
| 36 | 6 | 2023-09-21 | 429 | 30 | 26 | 4 | 2086 | B안 | 0.069930 | 1.538462 | 910 | 1176 |
| 37 | 7 | 2023-09-22 | 474 | 30 | 24 | 6 | 2604 | B안 | 0.063291 | 1.772152 | 840 | 1764 |
| 38 | 8 | 2023-09-23 | 577 | 38 | 29 | 9 | 3661 | B안 | 0.065858 | 2.062392 | 1015 | 2646 |
| 39 | 9 | 2023-09-24 | 565 | 36 | 29 | 7 | 3073 | B안 | 0.063717 | 1.752212 | 1015 | 2058 |
| 40 | 10 | 2023-09-25 | 433 | 31 | 25 | 6 | 2639 | B안 | 0.071594 | 1.963048 | 875 | 1764 |
| 41 | 11 | 2023-09-26 | 511 | 36 | 27 | 9 | 3591 | B안 | 0.070450 | 2.289628 | 945 | 2646 |
| 42 | 12 | 2023-09-27 | 532 | 35 | 29 | 6 | 2779 | B안 | 0.065789 | 1.672932 | 1015 | 1764 |
| 43 | 13 | 2023-09-28 | 520 | 37 | 32 | 5 | 2590 | B안 | 0.071154 | 1.576923 | 1120 | 1470 |
| 44 | 14 | 2023-09-29 | 459 | 32 | 26 | 6 | 2674 | B안 | 0.069717 | 1.873638 | 910 | 1764 |
| 45 | 15 | 2023-09-30 | 572 | 39 | 35 | 4 | 2401 | B안 | 0.068182 | 1.311189 | 1225 | 1176 |
| 46 | 16 | 2023-10-01 | 524 | 36 | 29 | 7 | 3073 | B안 | 0.068702 | 1.889313 | 1015 | 2058 |
| 47 | 17 | 2023-10-02 | 424 | 29 | 24 | 5 | 2310 | B안 | 0.068396 | 1.745283 | 840 | 1470 |
| 48 | 18 | 2023-10-03 | 519 | 34 | 27 | 7 | 3003 | B안 | 0.065511 | 1.868979 | 945 | 2058 |
| 49 | 19 | 2023-10-04 | 528 | 38 | 32 | 6 | 2884 | B안 | 0.071970 | 1.742424 | 1120 | 1764 |
| 50 | 20 | 2023-10-05 | 525 | 37 | 35 | 2 | 1813 | B안 | 0.070476 | 1.047619 | 1225 | 588 |
| 51 | 21 | 2023-10-06 | 532 | 36 | 29 | 7 | 3073 | B안 | 0.067669 | 1.860902 | 1015 | 2058 |
| 52 | 22 | 2023-10-07 | 504 | 39 | 28 | 11 | 4214 | B안 | 0.077381 | 2.738095 | 980 | 3234 |
| 53 | 23 | 2023-10-08 | 554 | 38 | 28 | 10 | 3920 | B안 | 0.068592 | 2.310469 | 980 | 2940 |
| 54 | 24 | 2023-10-09 | 510 | 35 | 27 | 8 | 3297 | B안 | 0.068627 | 2.098039 | 945 | 2352 |
| 55 | 25 | 2023-10-10 | 509 | 34 | 28 | 6 | 2744 | B안 | 0.066798 | 1.728880 | 980 | 1764 |
| 56 | 26 | 2023-10-11 | 543 | 35 | 27 | 8 | 3297 | B안 | 0.064457 | 1.970534 | 945 | 2352 |
| 57 | 27 | 2023-10-12 | 520 | 34 | 28 | 6 | 2744 | B안 | 0.065385 | 1.692308 | 980 | 1764 |
| 58 | 28 | 2023-10-13 | 475 | 35 | 27 | 8 | 3297 | B안 | 0.073684 | 2.252632 | 945 | 2352 |
| 59 | 29 | 2023-10-14 | 497 | 29 | 22 | 7 | 2828 | B안 | 0.058350 | 1.851107 | 770 | 2058 |
1
data.info()
1
2
3
4
5
6
7
8
9
10
11
12
13
14
15
16
17
18
19
<class 'pandas.core.frame.DataFrame'>
RangeIndex: 60 entries, 0 to 59
Data columns (total 12 columns):
 #   Column                Non-Null Count  Dtype
---  ------                --------------  -----
 0   Unnamed: 0            60 non-null     int64
 1   Date                  60 non-null     object
 2   Total Users           60 non-null     int64
 3   Subscribers           60 non-null     int64
 4   1-Month Subscribers   60 non-null     int64
 5   12-Month Subscribers  60 non-null     int64
 6   Revenue               60 non-null     int64
 7   Group                 60 non-null     object
 8   Conversion Rate       60 non-null     float64
 9   Revenue per User      60 non-null     float64
 10  1-Month Revenue       60 non-null     int64
 11  12-Month Revenue      60 non-null     int64
dtypes: float64(2), int64(8), object(2)
memory usage: 5.8+ KB
1
data.isna().sum()
| 0 | |
|---|---|
| Unnamed: 0 | 0 |
| Date | 0 |
| Total Users | 0 |
| Subscribers | 0 |
| 1-Month Subscribers | 0 |
| 12-Month Subscribers | 0 |
| Revenue | 0 |
| Group | 0 |
| Conversion Rate | 0 |
| Revenue per User | 0 |
| 1-Month Revenue | 0 |
| 12-Month Revenue | 0 |
1
2
3
4
5
6
7
8
9
10
11
12
13
14
15
16
17
18
19
20
21
22
23
24
25
26
27
28
29
30
31
32
33
34
35
36
37
38
39
40
41
42
43
44
45
46
47
48
from scipy.stats import ttest_ind

# `Date` 열을 datetime 형식으로 변환
data['Date'] = pd.to_datetime(data['Date'])

# 불필요한 `Unnamed: 0` 열 삭제
data.drop(columns=['Unnamed: 0'], inplace=True)

# 그룹별 전환율, 구독자 비율, 수익의 평균과 표준 편차 계산
group_stats = data.groupby('Group').agg(
    mean_conversion_rate=('Conversion Rate', 'mean'),
    std_conversion_rate=('Conversion Rate', 'std'),
    mean_subscribers=('Subscribers', 'mean'),
    std_subscribers=('Subscribers', 'std'),
    mean_revenue=('Revenue', 'mean'),
    std_revenue=('Revenue', 'std')
)

# 그룹별 1개월, 12개월 구독자 비율의 평균과 표준 편차를 계산
group_stats['mean_1month_ratio'] = data.groupby('Group')['1-Month Subscribers'].sum() / data.groupby('Group')['Subscribers'].sum()
group_stats['mean_12month_ratio'] = data.groupby('Group')['12-Month Subscribers'].sum() / data.groupby('Group')['Subscribers'].sum()

# t-검정을 사용하여 그룹 간 전환율, 구독자 비율, 수익, 1개월 구독자 비율, 12개월 구독자 비율의 차이를 검증
a_data = data[data['Group'] == 'A안']
b_data = data[data['Group'] == 'B안']
t_test_results = pd.DataFrame(
    {
        't_stat': [
            ttest_ind(a_data['Conversion Rate'], b_data['Conversion Rate'])[0],
            ttest_ind(a_data['Subscribers'], b_data['Subscribers'])[0],
            ttest_ind(a_data['Revenue'], b_data['Revenue'])[0],
            ttest_ind(a_data['1-Month Subscribers'] / a_data['Subscribers'], b_data['1-Month Subscribers'] / b_data['Subscribers'])[0],
            ttest_ind(a_data['12-Month Subscribers'] / a_data['Subscribers'], b_data['12-Month Subscribers'] / b_data['Subscribers'])[0],
        ],
        'p_value': [
            ttest_ind(a_data['Conversion Rate'], b_data['Conversion Rate'])[1],
            ttest_ind(a_data['Subscribers'], b_data['Subscribers'])[1],
            ttest_ind(a_data['Revenue'], b_data['Revenue'])[1],
            ttest_ind(a_data['1-Month Subscribers'] / a_data['Subscribers'], b_data['1-Month Subscribers'] / b_data['Subscribers'])[1],
            ttest_ind(a_data['12-Month Subscribers'] / a_data['Subscribers'], b_data['12-Month Subscribers'] / b_data['Subscribers'])[1],
        ]
    },
    index=['전환율', '구독자 수', '수익', '1개월 구독자 비율', '12개월 구독자 비율']
)

# 결과 출력
print("\n그룹별 전환율, 구독자 비율, 수익의 평균과 표준 편차:\n", group_stats)
print("\nt-검정 결과:\n", t_test_results)
1
2
3
4
5
6
7
8
9
10
11
12
13
14
15
16
17
18
19
20
21
22
23
그룹별 전환율, 구독자 비율, 수익의 평균과 표준 편차:
        mean_conversion_rate  std_conversion_rate  mean_subscribers  \
Group
A안                 0.048621             0.002077         24.766667
B안                 0.068373             0.003874         34.566667

       std_subscribers  mean_revenue  std_revenue  mean_1month_ratio  \
Group
A안            2.712466   1971.900000   431.619193           0.827725
B안            3.002107   2945.133333   535.137993           0.806172

       mean_12month_ratio
Group
A안               0.172275
B안               0.193828

t-검정 결과:
                 t_stat       p_value
전환율         -24.610706  2.187760e-32
구독자 수       -13.266637  3.234488e-19
수익           -7.753532  1.587098e-10
1개월 구독자 비율    1.950202  5.599070e-02
12개월 구독자 비율  -1.950202  5.599070e-02
- 그룹별 전환율과 구독자 수, 수익은 p-값이 0.05 미만으로 통계적으로 유의미한 차이를 보임
- 1개월 구독자 비율과 12개월 구독자 비율은 p-값이 0.05보다 크게 나타나 통계적으로 유의미한 차이를 보이지 않음
1
2
3
4
5
6
7
8
9
10
11
12
13
14
15
16
17
18
19
import seaborn as sns
import matplotlib.pyplot as plt

plt.figure(figsize=(10, 6))
ax1 = sns.lineplot(data=data, x='Date', y='Conversion Rate', hue='Group')
plt.title('시간에 따른 전환율 변화')
plt.xlabel('날짜')
plt.ylabel('전환율')
plt.legend(title='그룹')
plt.xticks(rotation=45)

for line in ax1.lines:
    y_data = line.get_ydata()
    x_data = line.get_xdata()
    for x, y in zip(x_data, y_data):
        ax1.text(x, y, f'{y:.2f}', fontsize=9, ha='center', va='bottom')

plt.tight_layout()
plt.show()
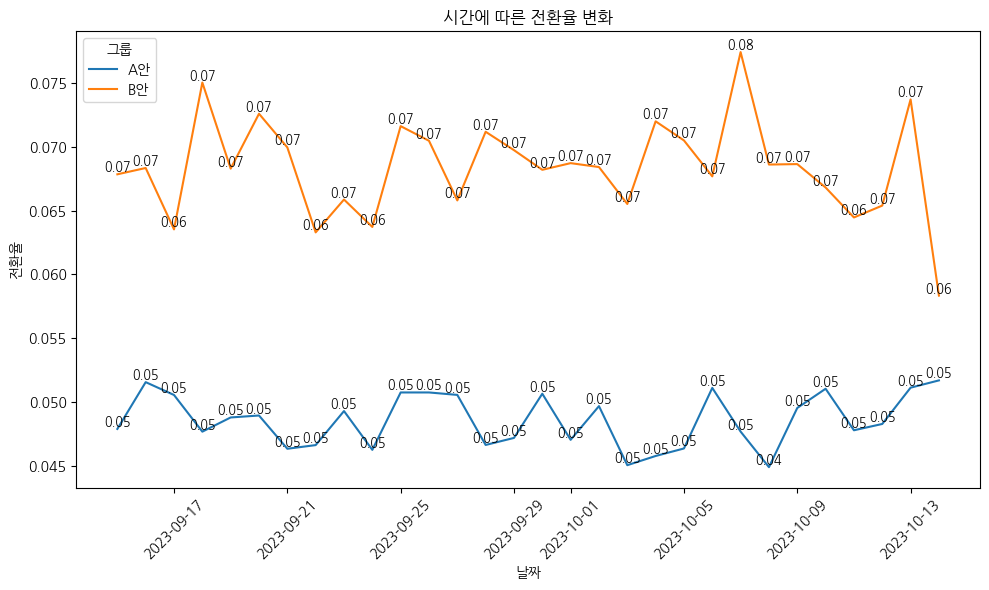
- 전반적으로 전환율은 A안보다 B안이 높게 형성됨
1
2
3
4
5
6
7
8
9
10
11
12
13
14
15
16
plt.figure(figsize=(10, 6))
ax2 = sns.lineplot(data=data, x='Date', y='Subscribers', hue='Group')
plt.title('시간에 따른 구독자 수 변화')
plt.xlabel('날짜')
plt.ylabel('구독자 수')
plt.legend(title='그룹')
plt.xticks(rotation=45)

for line in ax2.lines:
    y_data = line.get_ydata()
    x_data = line.get_xdata()
    for x, y in zip(x_data, y_data):
        ax2.text(x, y, f'{y:.0f}', fontsize=9, ha='center', va='bottom')

plt.tight_layout()
plt.show()
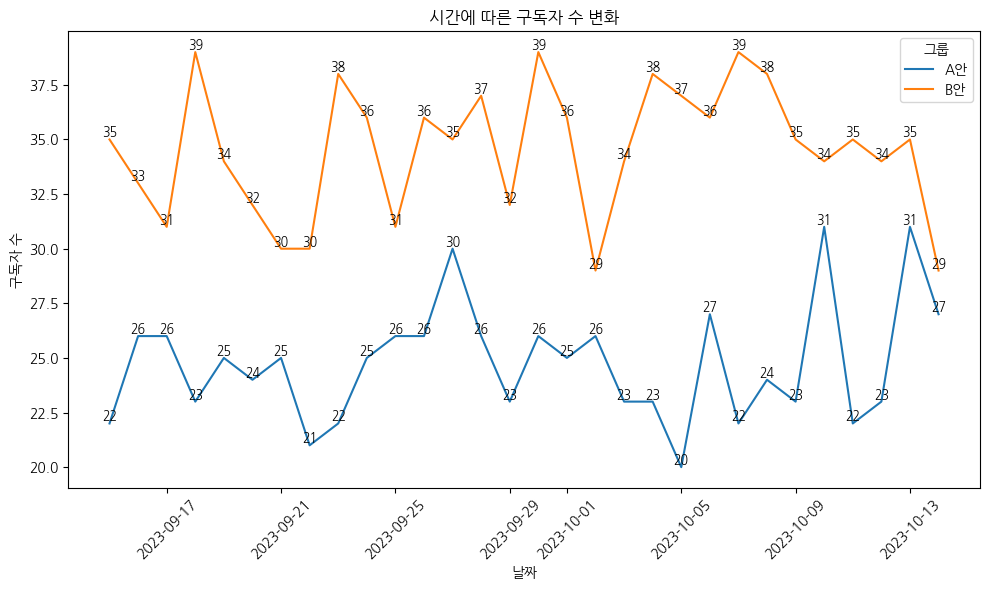
- A안보다 B안의 구독자 수가 더 높게 나타남
1
2
3
4
5
6
7
8
9
10
11
12
13
14
15
16
plt.figure(figsize=(10, 6))
ax3 = sns.lineplot(data=data, x='Date', y='Revenue', hue='Group')
plt.title('시간에 따른 수익 변화')
plt.xlabel('날짜')
plt.ylabel('수익')
plt.legend(title='그룹')
plt.xticks(rotation=45)

for line in ax3.lines:
    y_data = line.get_ydata()
    x_data = line.get_xdata()
    for x, y in zip(x_data, y_data):
        ax3.text(x, y, f'{y:.2f}', fontsize=9, ha='center', va='bottom')

plt.tight_layout()
plt.show()
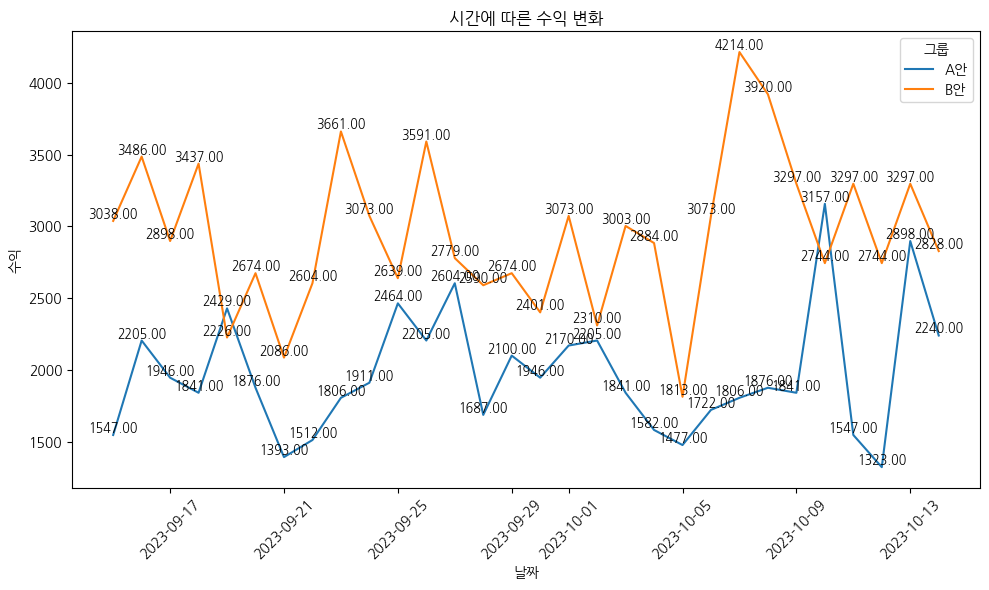
수익또한 A안보다 B안이 더 높게 형성됨
- 결론 : B안(변경안)을 채택하는 것을 제안함
- 근거
- B안은 A안보다 전환율과 수익이 통계적으로 유의미하게 증가함
- 통계적으로 유의미하지는 않지만 12개월 구독자 비율도 B안이 더 증가하는 경향이 있음
- 현금 흐름 개선을 위해 12개월 구독자 비율이 높은 B안 채택이 합리적인 선택요소 중 하나임
This post is licensed under CC BY 4.0 by the author.